Congressional Trades
Disclosed Periodic Transaction Reports (PTRs) ranked by each member's average per-buy excess return vs the S&P 500 — measured over a 6-month (180-day) hold from the disclosure date, across buys filed in the trailing 36 months — weighted by legislative effectiveness and committee power. · as of 2026-10-20
What the delay costs you
The STOCK Act gives members up to 45 days to disclose, and the filings in this feed arrived an average of 13 days after the trade. By the time a disclosure is public the market has had weeks to react — you are reading month-old positioning, not a live entry signal. Treat it as a map of where well-connected money is leaning, never as a fill price.
What you can actually learn
Members trade the industries their committees oversee. A defense buy from an Armed Services seat, or a chip buy from Science & Tech, is the trade worth a second look.
One politician buying a stock is noise. Several — ideally across both parties — accumulating the same name in the same window is the real signal.
A $1M–$5M purchase carries far more information than a $1K–$15K dabble. Weight the disclosed dollar range, not the headcount.
The law allows up to 45 days to file, so a trade can be weeks old before it is public. Read it to see where well-connected money is leaning — never as a live entry signal.
Recent disclosed trades
Newest filings first · Gap = days from trade to disclosure| Politician | Ticker | Type | ~Value | Net held · est. | Traded | Filed | Gap |
|---|---|---|---|---|---|---|---|
 Gilbert Cisneros D · CA-31 | BHE | ▲ Buy | $33K | $33K | Oct 1 | Oct 9 | 8d |
Gilbert Cisneros D · CA-31 | ITT | ▼ Sell | $33K | −$33K | Sep 29 | Oct 9 | 10d |
Gilbert Cisneros D · CA-31 | MTSI | ▼ Sell | $33K | −$33K | Sep 29 | Oct 9 | 10d |
Gilbert Cisneros D · CA-31 | NXPI | ▲ Buy | $33K | $33K | Sep 9 | Oct 9 | 30d |
Gilbert Cisneros D · CA-31 | ON | ▲ Buy | $33K | $33K | Sep 28 | Oct 9 | 11d |
Gilbert Cisneros D · CA-31 | RBC | ▼ Sell | $33K | −$33K | Sep 14 | Oct 9 | 25d |
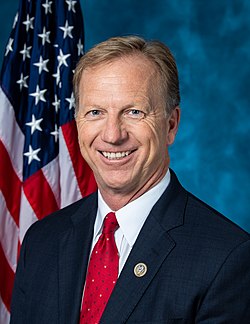 Kevin Hern R · OK-01 | DVN | ▼ Sell | $75K | $185K | Sep 23 | Oct 2 | 9d |
Kevin Hern R · OK-01 | LMT | ▼ Sell | $33K | −$65K | Sep 23 | Oct 2 | 9d |
Kevin Hern R · OK-01 | MRSH | ▼ Sell | $75K | −$75K | Sep 23 | Oct 2 | 9d |
Kevin Hern R · OK-01 | SBUX | ▼ Sell | $33K | −$33K | Sep 23 | Oct 2 | 9d |
Kevin Hern R · OK-01 | UNH | ▼ Sell | $33K | −$365K | Sep 23 | Oct 2 | 9d |
 Maria Elvira Salazar R · FL-27 | CSCO | ▼ Sell | $33K | −$33K | Sep 24 | Oct 1 | 7d |
Maria Elvira Salazar R · FL-27 | SNOW | ▲ Buy | $33K | $33K | Sep 4 | Oct 1 | 27d |
 Lisa Mcclain R · MI-09 | HANTZ | ▲ Buy | $33K | $33K | Sep 14 | Oct 1 | 17d |
Lisa Mcclain R · MI-09 | RIG | ▲ Buy | $33K | $33K | Sep 14 | Oct 1 | 17d |
 Pete Sessions R · TX-17 | GOOGL | ▼ Sell | $33K | −$33K | Sep 14 | Sep 18 | 4d |
Richard W Allen R · GA-12 | ROL | ▼ Sell | $33K | −$33K | Aug 12 | Sep 15 | 34d |
Kevin Hern R · OK-01 | BSX | ▼ Sell | $75K | −$108K | Sep 9 | Sep 15 | 6d |
Kevin Hern R · OK-01 | BSX | ▼ Sell | $33K | −$108K | Aug 31 | Sep 15 | 15d |
Kevin Hern R · OK-01 | RA | ▼ Sell | $33K | −$33K | Aug 31 | Sep 15 | 15d |
Kevin Hern R · OK-01 | CNP | ▼ Sell | $33K | −$33K | Sep 15 | Sep 15 | 0d |
Kevin Hern R · OK-01 | CXT | ▼ Sell | $33K | −$33K | Aug 31 | Sep 15 | 15d |
Kevin Hern R · OK-01 | DVN | ▼ Sell | $33K | $185K | Aug 31 | Sep 15 | 15d |
Kevin Hern R · OK-01 | HD | ▼ Sell | $33K | $318K | Sep 14 | Sep 15 | 1d |
Kevin Hern R · OK-01 | ITW | ▼ Sell | $33K | $43K | Aug 31 | Sep 15 | 15d |
Kevin Hern R · OK-01 | ITW | ▼ Sell | $33K | $43K | Sep 9 | Sep 15 | 6d |
Kevin Hern R · OK-01 | LIN | ▼ Sell | $33K | −$33K | Sep 2 | Sep 15 | 13d |
Kevin Hern R · OK-01 | LMT | ▼ Sell | $33K | −$65K | Sep 2 | Sep 15 | 13d |
Kevin Hern R · OK-01 | OKE | ⇄ Exchange | $175K | — | Sep 11 | Sep 15 | 4d |
Kevin Hern R · OK-01 | PBA | ▼ Sell | $33K | −$33K | Aug 27 | Sep 15 | 19d |
Most-traded in recent filings
Where the last 30 disclosed filings cluster — repeated names are the ones worth a second look.
NANC vs S&P 500 since Feb 2023
NANC (the live Democratic-Congress copy-trade ETF) is the only real-money benchmark for disclosure-date copy trading. The edge has compressed from +3.21pp to +1.88pp annualized.
Top 10 by composite score
z-weighted: 50% avg 6-mo excess return per buy · 30% legislative effectiveness · 20% committee power| # | Member | Party | Chamber | Composite | Avg 6-mo excess / buy |
|---|---|---|---|---|---|
| 1 | — | R | House | 0.70 | ▲ 12.0% |
| 2 | — | D | House | -0.27 | ▲ 5.2% |
| 3 | — | D | House | -0.43 | ▲ 4.1% |

Source: Senate & House PTR disclosures via Senate/House Stock Watcher. Updated daily. Not investment advice.